
The government's newest resource statistics confirm what most people already suspect — coal remains the backbone of India's energy economy — but the data around it tells a much bigger story, from renewables to farms to fisheries
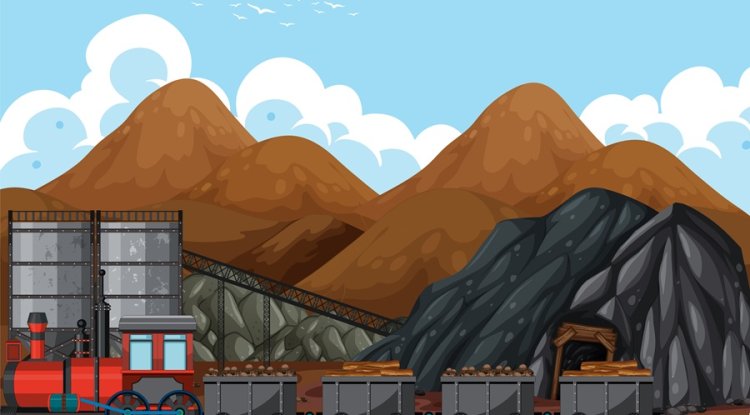
India's coal production has climbed to a record 1,047.7 million tonnes in 2024-25 (provisional), marking a significant rise from 675.4 million tonnes in 2017-18, according to the latest EnviStats India 2025 report. While thermal power continues to dominate electricity generation, renewable sources are expanding rapidly, reflecting a gradual transition toward sustainable resource management.
The report — Component 2 of EnviStats India 2025, put out annually and quietly by the National Statistics Office — doesn't make headlines the way a budget speech does. But buried in its tables and charts is a fairly clear-eyed picture of where India's growth is still being powered from, and how fast that's starting to shift.
The report stitches together data from the coal sector, the power grid, irrigation departments, organic farming certifiers, pesticide regulators, livestock census officials and fisheries boards — six subcomponents in total, spanning minerals, energy, land, soil, biological resources and water.
Let's read the sector-wise breakup.
Coal: Dominant The Story
That production climb hasn't bent downward once across the seven years it covers — a steady, almost stubborn upward line. Nothing else in India's resource economy moves at this scale.
The country's geological reserves explain why. Non-coking coal alone accounts for the overwhelming bulk of proved, indicated and inferred reserves, dwarfing every other coal category combined — prime coking, medium coking and blendable coal barely register next to it on the chart. This isn't a resource India is running low on; if anything, the reserve base suggests decades of extraction still ahead at current rates.
Total primary supply of coal — production plus net imports plus stock changes — has followed the same trajectory, climbing from under 640 million tonnes in 2011-12 to well over 1,200 million tonnes by 2023-24. Lignite, by contrast, has stayed largely flat across the same period, hovering in the 40-48 million tonne range without any real growth story of its own. Coal, not lignite, is doing all the heavy lifting essentially.
What that supply feeds into is unmistakable in the power generation numbers. Thermal generation — coal and lignite doing most of the work — rose from 7.92 lakh GWh in 2013-14 to 13.27 lakh GWh in 2023-24. Coal and lignite alone accounted for nearly 12.95 lakh GWh of that most recent year. In a country still adding capacity as fast as India is, thermal power remains the default answer to "where does the electricity come from" — and by a wide margin.
The Renewables Story Sits Right Behind It
Coal's dominance doesn't mean the rest of the power sector is standing still. Renewable energy generation has more than tripled over the same decade — from 65,520 GWh in 2013-14 to 2,25,835 GWh in 2023-24. That's the fastest-growing line on the entire generation chart, and it's been accelerating rather than plateauing. Hydro and nuclear have both grown too, though at a noticeably gentler pace than renewables, suggesting India's clean-energy growth right now is being written primarily by solar and wind, not by the older non-fossil sources.
There's a second, less obvious data point worth sitting with: India flipped from being a net electricity importer to a net exporter somewhere around 2017-18, and has stayed a net exporter in most years since, with exports touching nearly 13,792 GWh against gross imports of roughly 11,362 GWh in the most recent reported year. A country that used to draw power across its borders now sends more out than it takes in — not proof of a clean transition on its own, but a sign of a generation base that's grown well beyond what it once needed to import.
Land and Water: Farming More, Irrigating Harder
The report treats land as something more than just acreage — it draws a distinction between land cover, the physical, biophysical state of the ground, and land use, what that ground is actually being made to do. The two move together but aren't the same thing, and a lot of India's environmental change over the past few decades shows up first as a shift in use, long before it shows up as a shift in cover.
Nowhere is that clearer than in irrigation. Net irrigated area in India has grown from 55,112 thousand hectares in 1997-98 to 79,312 thousand hectares by 2022-23, with tube wells consistently doing more of that work than any other irrigation source — government canals, private canals and tanks included. Gross irrigated area tells the same story at a larger scale, crossing 1.22 lakh thousand hectares in the same period. That reliance on tube-wells over surface sources like canals and tanks isn't a neutral detail; it points to groundwater, not river or reservoir water, as the resource India's farms have leaned on hardest to expand their reach over the past 25 years — a fact with its own long-term water security implications that this dataset doesn't fully spell out, but that hangs over every irrigation figure in it.
Running alongside that expansion is a quieter but genuinely notable shift: organic farming now covers over 73 lakh hectares in India, registered and certified. Madhya Pradesh leads by a wide margin with more than 20.5 lakh hectares under organic cultivation, followed by Maharashtra and Rajasthan. It's a small fraction of India's total cultivated area, but it's no longer a rounding error either — and the fact that three states account for such a disproportionate share suggests organic farming in India is still concentrated rather than genuinely nationwide. Whether that concentration spreads further or stays a handful of states' story is likely to be one of the more interesting subplots in next year's edition of this same report.
Foodgrain output has grown alongside the irrigated area feeding it. The area under major foodgrain crops itself has grown from 1,01,196 hectares in 1950-51 to around 1,32,104 hectares in 2023-24 — a rise of roughly 30.5 per cent over seven decades, with rice and wheat doing almost all of that expanding, while coarse cereals like jowar and bajra have quietly lost ground, likely a reflection of changing diets as much as changing farm economics. On the production side, rice output rose from 105.5 million tonnes in 2014-15 to an estimated 136.4 million tonnes in 2024-25; wheat climbed from 86.5 to 115.4 million tonnes over the same window. Oilseed production — soyabean and rapeseed-mustard in particular — pushed total output from 275.1 to 416.7 lakh tonnes. Sugarcane peaked in 2022-23 before easing off slightly, a reminder that not every crop's growth curve points in one direction indefinitely.
Pesticide Use Is Coming Down From Its Peak
One of the more encouraging threads in the data concerns pesticide consumption, which climbed fairly consistently from the early 2000s through to a peak of 63.41 thousand tonnes in 2017-18, before beginning a real decline — down to 53.63 thousand tonnes by 2022-23. Whether that's a function of better pest management, a genuine shift toward organic and sustainable practices, or simply market and price dynamics is hard to say from the data alone. But five straight years of declining pesticide use, after two decades of mostly climbing, is the kind of inflection point worth watching rather than dismissing — especially set against the organic farming numbers sitting right next to it in the same report. It's tempting to read the two trends as cause and effect, but the report itself doesn't draw that line, and neither should we without more to go on.
Livestock and Fisheries
India's livestock numbers have followed a long, largely uninterrupted climb — from 292.8 million animals in 1951 to 536.76 million by 2019. Cattle and buffalo remain the backbone of that count. Still, the sharpest growth by far has come from poultry, which rocketed from 73.5 million birds in 1951 to 851.81 million — an eleven-fold increase that tracks almost exactly with the rise in demand for poultry products over the same period. Goats and sheep have grown too, if more modestly.
The one group moving in the opposite direction: working animals. Horses, donkeys, camels and mules have all seen steady, sustained declines — a fairly direct reflection of how little Indian agriculture and transport still depend on draft animals compared to a generation ago.
Fisheries data tells its own growth story. Inland fish production has nearly tripled, from 48.94 lakh tonnes in 2009-10 to 139.07 lakh tonnes in 2023-24 — a boom driven largely by aquaculture and freshwater fish farming rather than the open sea. Marine fish production has grown too, but far more slowly, up from 31.04 to 44.95 lakh tonnes across the same period. Inland aquaculture, in other words, is now doing most of the work of feeding India's growing appetite for fish, not the ocean.
What the Numbers Add Up To
None of this data, on its own, tells a simple story of an economy going green — or one refusing to. What it shows instead is a country still anchored to coal at its core, even as everything built around that core — power generation, farming, pesticide use, fisheries — shifts in a noticeably cleaner direction. Coal production hasn't peaked. But renewable generation is growing at a rate coal never has. Pesticide use is falling for the first time in years. And an old agrarian economy built on tube-wells and draft animals is quietly being replaced by one built on aquaculture ponds and combine harvesters.
For a sustainability audience, the temptation is often to look for the single number that confirms the narrative — either that India is transitioning fast enough, or that it isn't. This dataset resists that kind of shorthand. Whether the pace outside coal adds up to progress fast enough depends entirely on what timeline you're willing to accept — and that's a judgment the numbers themselves don't make.
Source: EnviStats India 2025, Component 2 — Environmental Resources and Their Use, National Statistics Office, Ministry of Statistics and Programme Implementation
What's Your Reaction?